MacVitals
2026Every number is a syscall it makes itself.
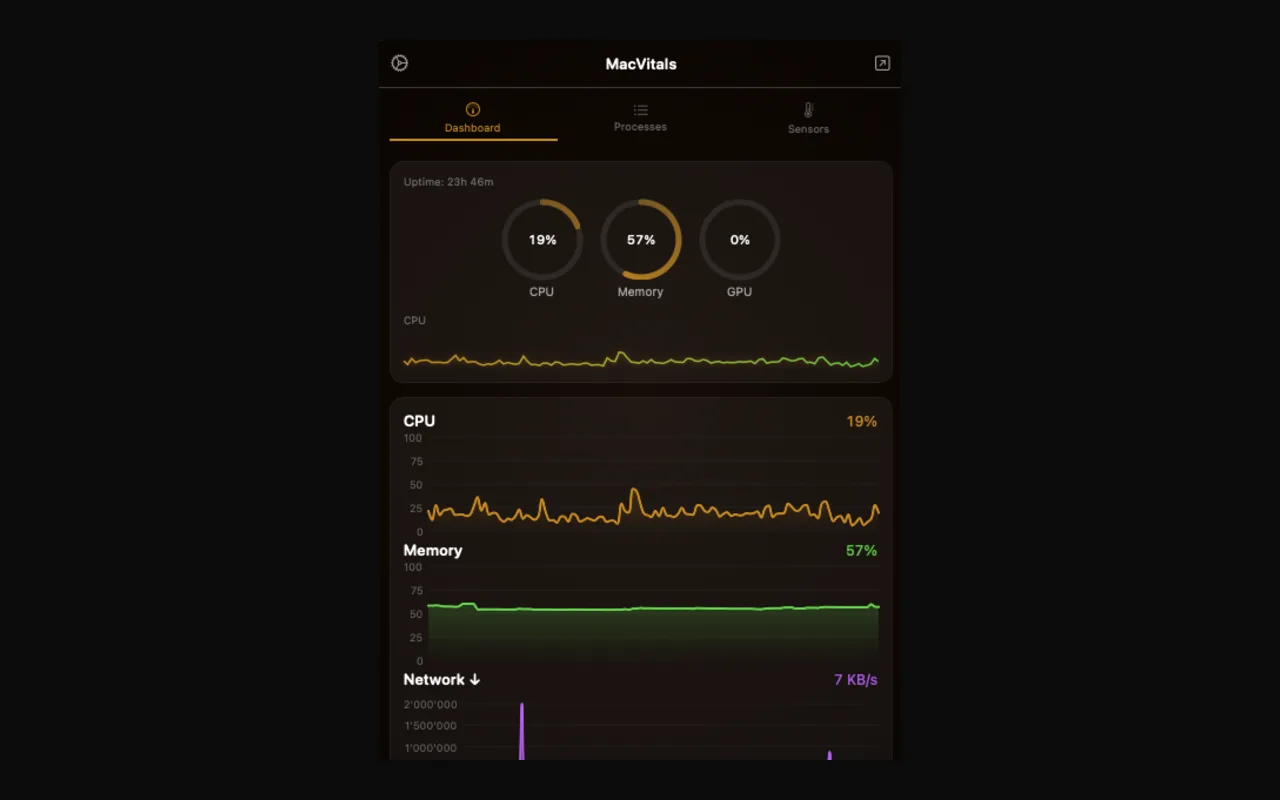
A menu bar app for CPU, memory, storage, battery, temperatures, fans, network and GPU. It has no dock icon, no third-party dependencies and no server — it is a thin skin over a pile of Mach and IOKit calls, and most of the work was in finding out what to call.
Swift 6 · SwiftUI · AppKit · IOKit · Mach · No dependencies
What it reads
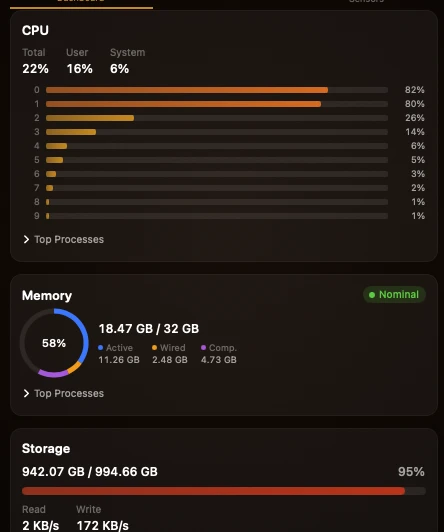
There is no framework for any of this. macOS exposes system vitals as a scattering of C APIs across Mach, IOKit and BSD, each with its own calling convention and its own units, and the app calls all of them directly.
| Metric | Call |
|---|---|
| CPU | host_processor_info(PROCESSOR_CPU_LOAD_INFO) |
| Memory | host_statistics64(HOST_VM_INFO64) |
| Storage | attributesOfFileSystem plus IOKit IOBlockStorageDriver statistics |
| Battery | IOPSCopyPowerSourcesInfo, then AppleSmartBattery for health and cycles |
| Temperatures and fans | the SMC, via AppleSMC |
| Network | getifaddrs |
| GPU | IOAccelerator, key Device Utilization % |
| Processes | proc_listpids, then proc_pidinfo(PROC_PIDTASKINFO) per pid |
Three things that only show up once you call them:
- You own the memory.
host_processor_infoallocates the array it hands back and the caller has to release it. The collector does that in adefer, so the early return on a failed call cannot leak it. - Swift cannot call one of them.
mach_task_self()is a C macro rather than a function, so it does not survive into Swift. The project ships a single header whose entire job is to wrap it in a realstatic inline— and, since it was there anyway, to declare the 80-byte struct the SMC driver expects. - The first reading is always wrong. CPU usage is a delta between two samples of cumulative tick counters, so the first tick after launch has nothing to subtract from and every core reads 0%.
The SMC is undocumented
Temperatures and fan speeds come from the System Management Controller, which Apple documents nowhere. There is no published list of keys, no header, and no way to ask what a machine supports. What there is, is an enumeration selector — so the app reads the key #KEY to get a total count, walks every index from zero to that count, and unpacks each 32-bit result into four ASCII characters.
That yields every key the machine has, of every kind. Narrowing it to temperatures is done the only way available: keep the keys that start with T, read each one, and keep it only if the number that comes back is between 0 and 150 °C. Plausibility is the validation. A sensor genuinely reading 200 °C would be discarded, and so would a real one reading below zero — but both of those are less likely than a non-temperature key that happens to start with a T.
Decoding is its own problem, because the SMC returns a four-character type code alongside the bytes and the encodings do not agree with each other:
| Type | Encoding |
|---|---|
sp78 | signed 8.8 fixed-point, big-endian |
fpe2 | unsigned 14.2 fixed-point, big-endian |
flt | IEEE 754 single precision, little-endian |
ioft | 8-byte IEEE 754 double, little-endian |
ui8, ui16, ui32, si16 | integers, big-endian |
The fixed-point types are big-endian and the float types are little-endian, in the same API, on the same connection. Anything with an unrecognised type code and two bytes of payload is decoded as sp78 and hoped for.
Naming what was found is a third problem. There are 63 hand-written key-to-label mappings — Intel and Apple Silicon use different keys for the same sensor, so TC0P and Tc0p are both listed — then a prefix rule that sorts anything unrecognised into CPU, GPU, memory, storage or ambient, and finally a fallback that just shows the raw four characters. Fans are enumerated separately: FNum for the count, then actual, minimum and maximum per fan.
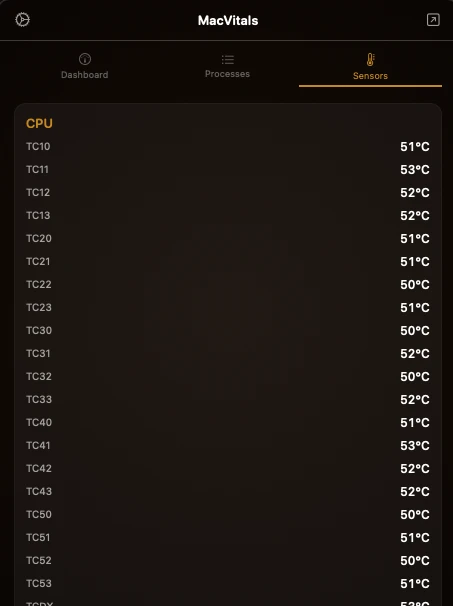
The screenshot below is the fallback doing its job. On the M1 Max these shots came from, the sweep keeps 227 sensors — far more than 63 labels can cover — so the prefix rule files them under CPU and the list shows their raw four-character keys, unchanged, all reading within a couple of degrees of each other. It is not pretty, and it is more honest than inventing names for keys nobody has documented.
What the menu bar can show
SwiftUI stops at the popover. The status item itself is an NSStatusItem, and its button takes an NSImage and a string — not a view. Three of the five display modes are therefore text, and the other two are drawn by hand into a bitmap.
| Mode | What it draws |
|---|---|
| Icon | the app icon, nothing else |
| Icon + CPU | the icon with total CPU as a percentage |
| Icon + temperature | the icon with the hottest sensor |
| CPU bar graph | a 24×18 bitmap, one bar per core, capped at twelve |
| Memory ring | an 18×18 ring, stroked from twelve o’clock |
Both graphical modes lock focus on an NSImage and stroke NSBezierPath into it on every refresh, switching from green to orange at 70% and to red at 90%. The two text modes set monospacedDigitSystemFont, for the same reason the tables on this page use tabular figures: a proportional 1 is narrower than a proportional 8, and a number that updates twice a second should not make the menu bar twitch.
One deliberate rudeness. A menu bar app has no windows, so ⌘Q reaches it from anywhere and kills it silently — which for a monitor means you discover it was not running when you go looking for a number. Quitting therefore raises a confirmation, and only the explicit Quit item in the app’s own menu sets a flag that skips it.
Sampling without being the problem
A system monitor that shows up near the top of its own process list has failed at its one job. The timer runs at one, two or five seconds, two by default, but not every collector runs on every tick.
The expensive one is the process table: proc_listpids for every pid on the system, then a separate proc_pidinfo call for each. It runs only when the popover is actually open, or every third tick otherwise — so a hidden app walks the process list once every six seconds at the default rate and reuses the previous answer in between. Bluetooth device enumeration is on the same schedule. Per-process CPU is a delta of user plus system nanoseconds against ProcessInfo.systemUptime, which is monotonic, rather than against wall-clock time, which is not.
History is four ring buffers of 120 samples — CPU, memory, and network in each direction — so the sparklines show four minutes at the default rate and the memory cost is fixed. Snapshots also go to a recorder that keeps an hour in memory and writes nothing to disk unless you explicitly export a CSV.
The dashboard on port 8765
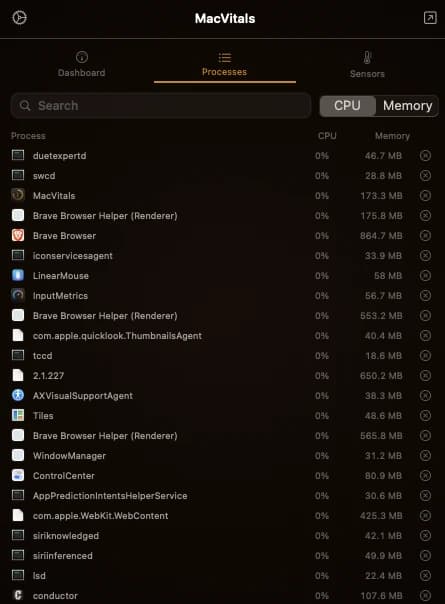
The most interesting thing in the app is off by default and documented nowhere. Enabling it in settings starts an NWListener on port 8765 with two routes: /api/status returns the current snapshot as JSON, and everything else returns a dashboard that polls it every two seconds.
The dashboard ships no assets. Its HTML, CSS and JavaScript are one Swift multiline string literal in the source file — which is either the correct amount of engineering for a feature like this or an admission that it was never meant to grow.
Two things worth stating plainly, because the project’s own landing page claims the app makes zero network requests and has no network entitlements. That is true of the shipped defaults and not of the app. This listener is created from NWParameters.tcp with no interface restriction, so it binds every interface rather than loopback, and the JSON route answers with Access-Control-Allow-Origin: * — on a shared network it is reachable by anything that can guess the port. And the optional external-IP display fetches from a third-party endpoint, cached for five minutes. Both are opt-in, both are off until you turn them on, and neither is nothing.
Three numbers to distrust
Most of what the app shows is a number the kernel already knows, copied. Three are not, and it is worth naming which.
- Memory pressure is a ratio. The app calls it critical above 90% and a warning above 75%, where the figure is active plus wired plus compressed over physical memory. macOS has a real signal for this —
DISPATCH_SOURCE_TYPE_MEMORYPRESSURE, which the kernel raises when it means it — and the source comment says why it is not used: it needs a long-lived dispatch source, and this is a polling collector. The consequence is that the critical-memory notification fires on a threshold the app chose, not on anything the kernel said. - The default gateway is scraped. Every other number here is a syscall. This one runs
/usr/sbin/netstat -rnin a subprocess and looks for the line beginningdefault. It is the only place the app shells out, it is possible only because the app is unsandboxed — the same property that buys it SMC access and the process list — and it is uncached, so the app that works hard to stay out of its own process list forks one every tick. - Battery health is simply wrong. It divides
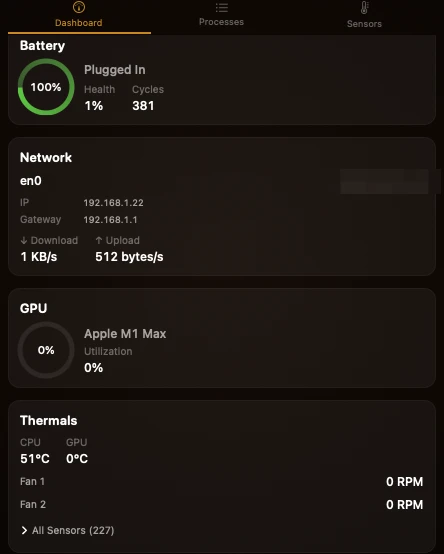
MaxCapacitybyDesignCapacityand clamps the result at 100. On Intel that was right:MaxCapacitywas a charge in mA·h, and a new cell can report slightly more than it was designed for, which is what the clamp is for. On Apple Silicon the same key means something else entirely — it is a normalised percentage, and it is always 100. So the sum becomes 100 divided by a four-figure mA·h number, the clamp guards a case that can no longer happen, and the app reports a healthy battery as 1%.
The screenshot below is that bug. The battery in it has 381 cycles and a true capacity of 84%, which macOS will tell you from NominalChargeCapacity — a key the app never reads. It is the same trap as the sensor labels two sections up, where TC0P and Tc0p need separate entries: a key name that survived the architecture transition while its meaning did not.
One smaller one, for completeness. Bluetooth device types are guessed by looking for keyboard, mouse, trackpad and friends in the product name.
Shipping it
Twelve days from first commit to the last release, 148 commits and 58 merged pull requests. Every release is a Developer ID–signed, Apple-notarized DMG, and getting there is the least elegant code in the project.
Pushing to main builds and tests, then cuts a semantic version tag from the conventional commits since the last one — feat: takes the minor, fix: the patch, and a push with neither tags nothing. Publishing a release from that tag, by hand, triggers the build. That job stamps the version into the plist, imports the signing certificate into a throwaway keychain, decodes the provisioning profile, archives, exports, notarizes the app, staples it, builds the DMG, notarizes that separately, staples again, and uploads.
It also rewrites the Xcode project file in place with a perl -i -0pe substitution, to flip the release configuration from automatic signing to manual and inject the identity and profile. There is no Xcode command-line flag for that, and this is what it looks like when you need one anyway.
The releases themselves record how well that went the first time:
| Version | Published | Asset | Downloads |
|---|---|---|---|
| 1.4.0 | 28 Mar 12:06 | DMG | 47 |
| 1.3.4 | 26 Mar 08:38 | DMG | 21 |
| 1.3.3 | 26 Mar 08:31 | — | — |
| 1.3.2 | 26 Mar 08:21 | DMG | 25 |
| 1.3.1 | 26 Mar 07:56 | — | — |
| 1.3.0 | 26 Mar 06:54 | — | — |
| 1.2.0 | 25 Mar 16:41 | DMG | 18 |
| 1.1.0 | 25 Mar 16:12 | DMG | 24 |
| 1.0.0 | 25 Mar 15:56 | ZIP | 2 |
Five versions went out in the hour and three quarters between 06:54 and 08:38 on 26 March, and three of them carry no downloadable asset at all — the tag was cut and published, and the build that was supposed to attach a DMG to it failed. Four of those five releases exist only because the previous one had broken the release job. Of nine published versions, six are actually installable; the other three are source archives with a version number.
All nine landed in the last four days of the project. The twelve-day figure is honest about when the code was written and quietly misleading about when any of it was shippable.